Your Tulip Is Wilting
Inflated assets, deflated reality, and can someone please tell Pollyanna there's a bear chasing her!?

Jerome Powell was recently asked in a congressional testimony, "Sir, what did [the FED] get wrong in your pandemic response?" His response was subtle political genius:
"I probably would have been faster to do what I did anyways." — Jerome Powell, Chairman of the Federal Reserve
Ray Dalio has been warning us for years that we were entering a new global order — that inflation would destabilize asset prices and the U.S. would lose its global edge. His Economic Machine framework and Changing World Order thesis were mostly right — just a bit too early.
Timing, when reliant on human input, rarely follows logic.
Flashback to My Own Prediction
In an August 2024 piece titled "Long Lag for High-Risk Debt Margin Correction & Likelihood of Recession," I flagged the following:
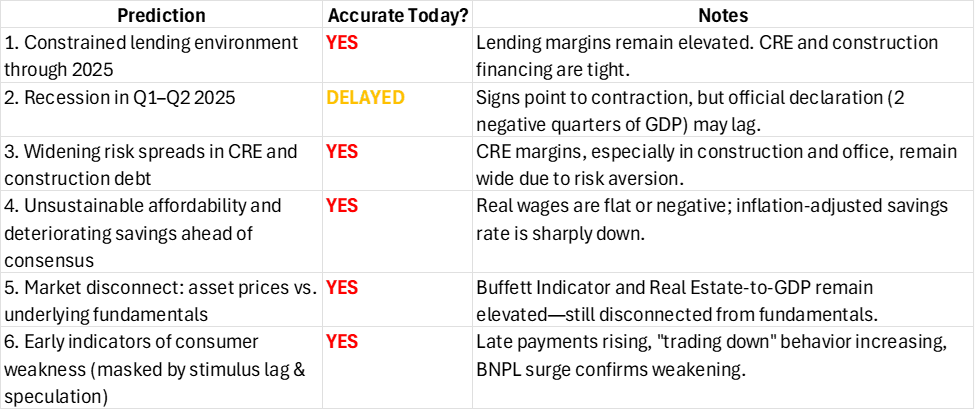
So Was I Wrong?
Like my much better pedigreed references above, the TIMING of my logic was off — but not wrong. Why? Because humans are irrational. Markets held their breath longer than logic would predict. But now, the signals are flashing red.
"Markets can remain irrational longer than you can remain solvent." — John Maynard Keynes
Worse, I underestimated:
- Posturing tariffs jacking up input costs
- Global devaluation of the USD
- Policy-fueled distortions lighting a match under an already fragile system
- Policy cuts (DOGE) and threats (immigration) to critical workforce
Observation (2025 Q3)
We're seeing asset prices ex-Real Estate continue to rise, while:
- Consumer affordability collapses
- Real wages stagnate
- Savings deteriorate
- Job mobility slows
- Input costs (tariffs) increase
- Optionality (also tariffs) decreases
This is not strength — it's a distortion.
If costs rise due to tariffs, labor, and subsidies, and if investors price in nominal earnings, then rising asset prices may be a hedge against currency debasement — not a sign of growth.
Investors aren't betting on productivity. They're betting on what assets will be worth in weaker dollars. They are betting that the loaf of bread they are investing in today will sell tomorrow for a wheelbarrow of cash.
Enter the Model
To test whether my thesis was early or incorrect, I created a first-principles diagnostic model — scoring key macroeconomic factors on a spectrum from contraction to expansion. I did NOT reference my initial predictions, instead stripping out the factors I weighed, added additional, and then backtested my previous prediction only once I scored the current climate.
Applied twice:
- August 2024: Score = +0.5 → (Artificial?) Stability
- Q3 2025: Score = –3.625 → Recessionary Contraction
The trend confirms it: we've exited the stability phase (however artificial that was, due to pandemic Black Swan revenge) and have seemingly entered a real contraction.
Model Inputs (15 Factors)
- Real Wage Growth
- Consumer Demand Trends
- Inflation-Adjusted Savings Rate
- Credit Usage
- Institutional Liquidity
- Commodity & Energy Prices
- Asset Inflation vs. CPI
- Retail Speculation
- Consumer Behavior Shifts
- Input Cost Pressures
- USD Strength
- Policy/Stimulus Behavior
- Real Estate Output to GDP
- Stock Market Cap to GDP
- Conference Board LEI
Each scored from –2 to +2 and weighted for macro impact. See the footnotes for data sources and expanded methodology.
Final Formula
Final Score = ∑(Fi × Wi) = –3.625 → Recessionary Contraction
Where Fi = score for factor i (scale: –2 to +2 based on economic signal) and Wi = weight for factor i (importance / macro influence).
Interpretation ranges:
- +6 and above — Inflationary Expansion: nominal asset growth, wealth gap rising
- +2 to +5.9 — Neutral Expansion: may mask structural imbalances
- –1 to +1.9 — Fragile / Artificial Stability
- –2 to –0.9 — Stagflation Risk
- Below –2 — Recessionary Contraction
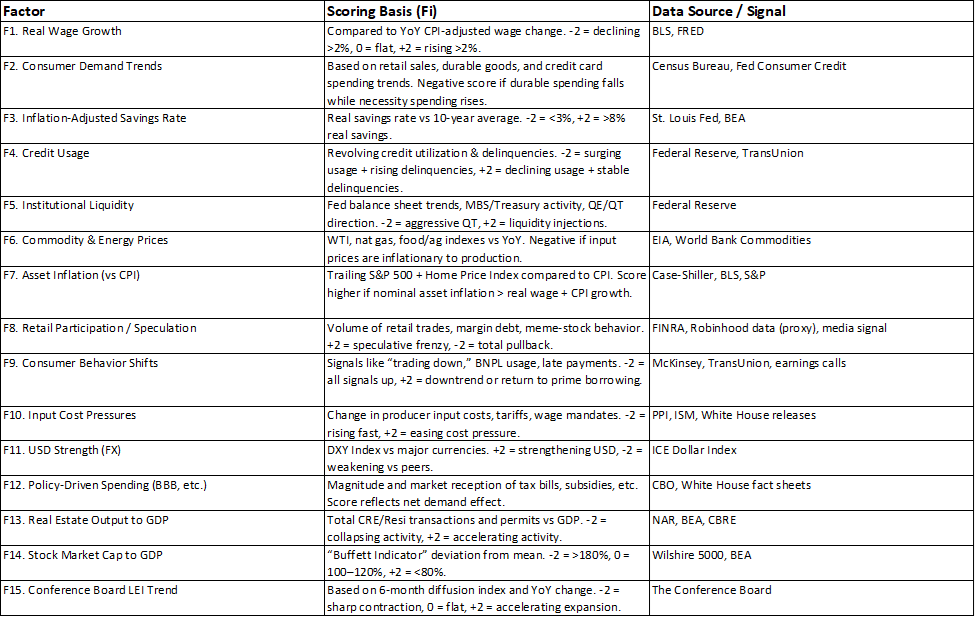
See sources and scoring methodology in the footnotes.
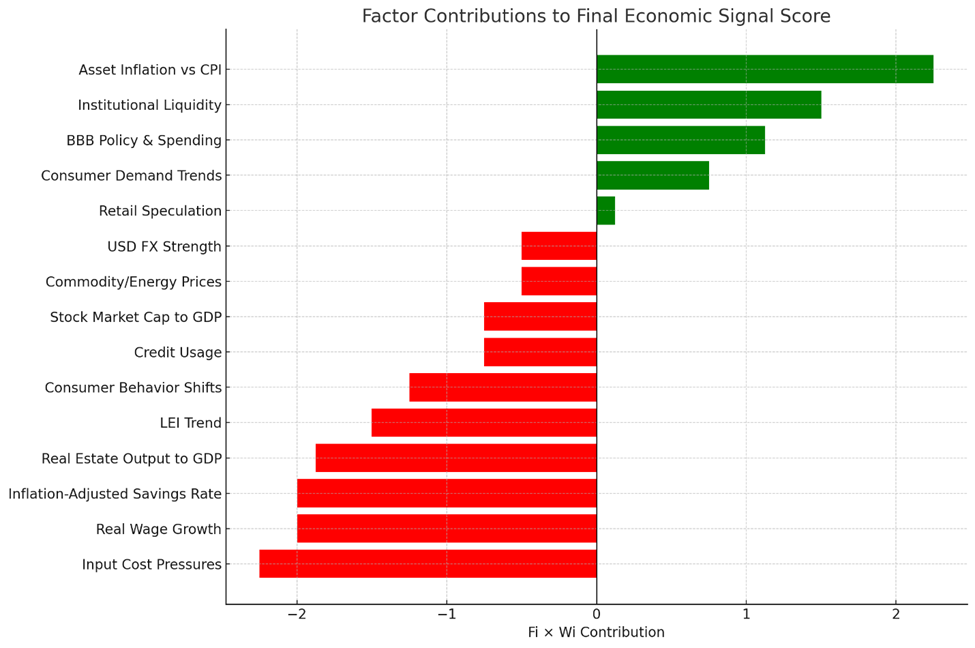
Scoring breakdown: (F1 – Real Wage Growth: –1 × 2.0 = –2.00) + (F2 – Consumer Demand Trends: +0.5 × 1.5 = +0.75) + (F3 – Inflation-Adjusted Savings Rate: –1 × 2.0 = –2.00) + (F4 – Credit Usage: –0.5 × 1.5 = –0.75) + (F5 – Institutional Liquidity: +1 × 1.5 = +1.50) + (F6 – Commodity & Energy Prices: –0.5 × 1.0 = –0.50) + (F7 – Asset Inflation vs CPI: +1.5 × 1.5 = +2.25) + (F8 – Retail Speculation: +0.25 × 0.5 = +0.125) + (F9 – Consumer Behavior Shifts: –1.25 × 1.0 = –1.25) + (F10 – Input Costs [Tariffs, Wages]: –1.5 × 1.5 = –2.25) + (F11 – USD FX Strength: –0.5 × 1.0 = –0.50) + (F12 – BBB Policy & Spending: +0.75 × 1.5 = +1.125) + (F13 – Real Estate Output to GDP: –1.25 × 1.5 = –1.875) + (F14 – Stock Market Cap to GDP: –0.75 × 1.0 = –0.75) + (F15 – LEI Trend: –1.0 × 1.5 = –1.50) = Final Score = –3.625
Real Estate & Equity Sector Outlook
Residential Real Estate: The Broken Ladder
Summary: We are witnessing an affordability collapse — not a housing boom. Mortgage rates remain elevated (~6.5–7.25%+), but wages have not kept up with inflation. The price-to-income and rent-to-income ratios have both broken historical norms. Even with limited housing supply, demand is stagnating — not because people don't want homes, but because they can't afford them.
Drivers:
- Affordability crisis: Monthly mortgage payments are up 60–100% since 2021 due to both price appreciation and rate hikes.
- Stagnant incomes: Real wages are flat to down YoY.
- Trapped supply: 60–70% of homeowners are locked into sub-4% mortgages. Few want — or can afford — to sell and re-buy.
- Rent pressure: Despite wage stagnation, rents remain elevated due to undersupply and institutional buy-to-rent strategies.
Outlook: Expect continued low transaction volume, squeezed margins for builders, and strong headwinds for first-time buyers. Policy intervention may try to stimulate demand (e.g. rate buydowns), but affordability won't return without price corrections or wage growth — neither of which seem imminent.
Commercial Real Estate (CRE): Propped Up, Not Prolific
Summary: Transaction volume is anemic. Valuations are suspect. Many deals are not happening because buyers and sellers are too far apart on cap rate expectations. Meanwhile, office remains in structural distress — particularly Class B and C — with permanent demand destruction.
Subsector breakdown:
- Office: Remote/hybrid work is now entrenched. Many Class B and C buildings are functionally obsolete. Lease roll-down risk and negative absorption plague urban office centers.
- Retail: Strong for essential and discount tenants (e.g. Dollar General, Aldi), but big-box and mall-based formats continue to struggle.
- Industrial: Still relatively healthy due to e-commerce and logistics demand, but cap rate pressure is emerging.
- Multifamily: Class A is overbuilt in some urban cores; Class B/C remains strong due to affordability demand. But rent growth is slowing, and expense pressures are rising (insurance, taxes, wage inflation).
- Hotels / Hospitality: High RevPAR in luxury/leisure markets, but softening in business travel segments. Financing remains tricky outside of top-tier brands.
Outlook: CRE debt maturities will drive forced sales and recapitalizations in H2 2025–2026. Expect price discovery via distress, especially in office, hotels, and overlevered multifamily projects.
Equity Market Outlook
Most at-risk sectors:
- Consumer Discretionary — Falling real wages, tighter credit, and high input costs are destroying margin and shrinking demand for non-essentials.
- Small Cap Growth — High debt sensitivity, low pricing power, and funding fragility make small caps especially vulnerable in a high-rate, low-liquidity world.
- Residential Construction — Builders face weak demand, affordability constraints, and volatile materials/labor pricing. Permits are declining.
- CRE REITs — Elevated cap rates, rising expense loads, and weak rent growth (especially in office/retail) are compressing NAVs and increasing debt rollover risk.
- Regional Banks — Exposure to CRE, tightening credit standards, and rising delinquencies in their loan books make them fragile. Deposit competition is eroding net interest margins.
Relatively hedged sectors:
- Mega-Cap Tech — Strong balance sheets, AI tailwinds, and global pricing power insulate against economic softness.
- Energy — Geopolitical instability, supply constraints, and low investment in upstream capacity support pricing. Cash flows remain strong.
- Defense — Rising global tensions, increasing government spend, and long-cycle contracts provide recession insulation.
- Class B Multifamily — Sweet spot for renters priced out of ownership or Class A luxury. High occupancy and stable rent collection.
- Retail (Discount/Value) — "Trading down" behavior favors brands like Dollar Tree, Walmart, and TJX. High turnover + pricing flexibility.
Strategic implication: The market isn't pricing risk correctly — it's pricing liquidity flow. Sectors that benefited most from free money and speculative froth are exposed. Sectors tied to real income and essential utility are gaining relative strength. Smart capital rotates from risk-on narratives to durable necessity — but the biggest risk is still the disconnect between asset prices and fundamental cash flows.
Disclaimer
Don't take market advice from me — I'm acronym-deficient and you're not paying me anyway. The views expressed are purely informational and unavoidably satirical. They do not constitute financial, legal, or investment advice. While the data is real, the bear chasing Pollyanna is metaphorical (for now). You should probably consult your financial advisor before making any investment moves — or shorting optimism. Honestly, your psychologist might prefer you keep the sunny outlook.
IMPORTANT NOTE: Written PRIOR to the creation of my Haruspex engine, which has since been revised slightly. For up to date methodology, please reference my Hobby Projects page (HARUSPEX).
Footnotes & Scoring Methodology
- F1 — Real Wage Growth (–1): Real average hourly earnings rose just 1.8% YoY (May 2024–May 2025), lagging core inflation. Source: BLS.
- F2 — Consumer Demand Trends (+0.5): Retail sales are steady, but growth is concentrated in discount/value channels, indicating trade-down behavior. Source: Census Bureau.
- F3 — Inflation-Adjusted Savings Rate (–1): U.S. personal savings rate remains near historic lows (~3.9%), far below pre-COVID levels. Source: FRED.
- F4 — Credit Usage (–0.5): Credit card balances and delinquency rates are rising, showing financial strain. Source: NY Fed.
- F5 — Institutional Liquidity (+1): QT pace has slowed and markets are pricing in rate cuts for 2025. Source: CME FedWatch.
- F6 — Commodity & Energy Prices (–0.5): Energy prices remain relatively stable, but food and input prices are still elevated. Source: BLS CPI.
- F7 — Asset Inflation vs. CPI (+1.5): S&P 500 is up ~18% YoY and home prices are climbing faster than inflation. Sources: S&P, FHFA.
- F8 — Retail Speculation (+0.25): Retail trading in meme stocks and crypto has ticked up modestly. Source: Vanda Research.
- F9 — Consumer Behavior Shifts (–1.25): Late payments and BNPL usage are rising; consumers trading down across categories. Sources: TransUnion, McKinsey.
- F10 — Input Cost Pressures (–1.5): New tariffs and labor mandates are raising production costs across industries. Sources: USTR, BLS PPI.
- F11 — USD FX Strength (–0.5): U.S. Dollar Index (DXY) is down ~4% YoY, reducing global purchasing power. Source: MarketWatch.
- F12 — BBB Policy & Spending (+0.75): The "Big Beautiful Bill" includes large-scale tax credits, but effects skew to asset holders. Source: CRFB.
- F13 — Real Estate Output to GDP (–1.25): Real estate remains ~13%+ of GDP despite contracting activity. Source: BEA.
- F14 — Stock Market Cap to GDP (–0.75): Buffett Indicator >180%, implying stock values far exceed GDP output. Source: Current Market Valuation.
- F15 — LEI Trend (–1.0): Conference Board LEI has declined 2.7% over the past six months. Source: The Conference Board.